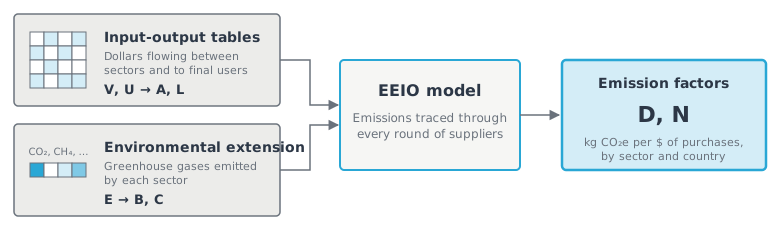
Figure 1:An EEIO model combines input-output tables with an environmental extension to produce emission factors.
Where EEIO comes from
EEIO grew out of economic input-output analysis when economist Wassily Leontief added the pollution generated by each sector to his model of the economy Leontief, 1970, and it has been a basis for carbon footprinting of nations, organizations, and products over the last few decades Minx et al., 2009. Cornerstone EEIO continues two of the longest-running US EEIO models, USEEIO and CEDA; see Origins of the Cornerstone EEIO.
The parts of the model
Each data component is put into a matrix, named by a letter that is common in input-output analysis and used throughout these docs (see Notation cheat sheet). Input-output analysis then combines the matrices with matrix algebra.
Input-output tables. The supply (
V) and use (U) tables record which sectors produce which products, and which products each sector and final user buys. From them come the direct requirements (A), the inputs a sector buys per dollar of its output, and the total requirements (L, the Leontief inverse), which add up the purchases through every round of suppliers. See The IO model: overview.Environmental extension. Emissions of each gas by each sector (
E), weighted by each gas’s global warming potential to give CO₂-equivalent and divided by the sector’s output, give the direct emission intensities (B). See The GHG extension: overview.Emission factors. Adding up the gases in
Bgives the direct emission factors (D), for what a sector emits itself. Combining them with the IO tables gives the total emission factors,N = D × L, for what is emitted across its whole supply chain.
EEIO and life cycle assessment
An EEIO model has the same matrix structure as the models used for life cycle assessment (LCA) Suh, 2005. In both, a matrix of the inputs each activity needs is inverted to trace every upstream supplier, and a matrix of emissions per unit of each activity is multiplied through it. The difference is that EEIO describes sectors in dollars, where LCA usually describes individual processes in physical units. Because of this shared structure, EEIO data can serve as background data in LCA, as discussed in Ingwersen (2026).
Multi-regional models
A single-country model assumes imported products are made the same way, and with the same emissions, as products made at home. A multi-regional input-output (MRIO) model instead links countries’ input-output tables through international trade, so each import carries the supply chain and emissions as it was produced in the origin country. For the companies reporting to the Carbon Disclosure Project (CDP), in one study using an MRIO model instead of a U.S. single-region model raised their estimated upstream emissions by about 10% Davis et al., 2025. The Cornerstone model is an MRIO model; see From single-country tables to the multi-region model.
Further reading
For a book-length introduction to EEIO and its use in LCA, see Hendrickson et al. (2006).
- Leontief, W. (1970). Environmental Repercussions and the Economic Structure: An Input-Output Approach. The Review of Economics and Statistics, 52(3), 262–271. 10.2307/1926294
- Minx, J. c., Wiedmann, T., Wood, R., Peters, G. p., Lenzen, M., Owen, A., Scott, K., Barrett, J., Hubacek, K., Baiocchi, G., Paul, A., Dawkins, E., Briggs, J., Guan, D., Suh, S., & Ackerman, F. (2009). Input-Output Analysis and Carbon Footprinting: An Overview of Applications. Economic Systems Research, 21(3), 187–216. 10.1080/09535310903541298
- Suh, S. (2005). Developing a Sectoral Environmental Database for Input–Output Analysis: The Comprehensive Environmental Data Archive of the US. Economic Systems Research, 17(4), 449–469. 10.1080/09535310500284326
- Ingwersen, W. (2026). Considering Input-Output Derived Data as Background Life Cycle Inventory Data. Int J Life Cycle Assess, 31(9), 164. 10.1007/s11367-026-02735-9
- Davis, S. J., Dumit, A., Li, M., Maldonado, Y., Steffen, M., Stevenson, M., Boldyreva, T., & Suh, S. (2025). The Importance of Multiregional Accounting for Corporate Carbon Emissions. Nat Commun. 10.1038/s41467-025-67759-5
- Hendrickson, C. T., Lave, L. B., & Matthews, H. S. (2006). Environmental Life Cycle Assessment of Goods and Services: An Input-Output Approach. Resources for the Future. 10.4324/9781936331383