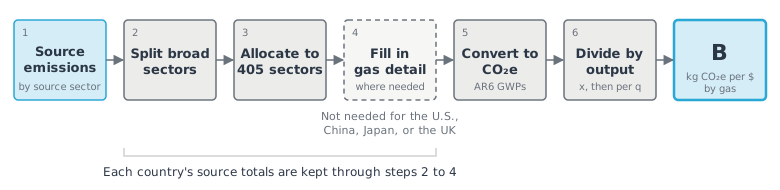
Figure 1:From source emissions to direct emission intensities (B). Every country follows the same steps; step 4 is needed only where a source does not separate every gas.
What the extension adds
The IO model traces the dollars that flow through supply chains. The GHG extension adds what each sector emits while making its output. For each country and sector it records:
Emissions (
E): the emissions of each gas by the sector in a year, in kilograms of CO₂-equivalent.Direct emission intensities (
B): those emissions divided by output, so kilograms of CO₂-equivalent of each gas per dollar of output.
B holds direct emissions only: what the sector emits from its own fuel use, processes, and other activities. Emissions from the sector’s suppliers come in through the supply chain (L), not through B. For example, the emissions from generating electricity stay with the power sector, and other sectors’ purchased electricity reaches them through L.
Each gas is weighted by its global warming potential as its emissions enter the model, so E and B are already in CO₂-equivalent and no separate weighting step is needed. Adding up the gases in B gives the direct emission factors D (see Notation cheat sheet).
Gases and global warming potentials
B has a row for each of seven gases or gas groups: carbon dioxide (CO₂), methane (CH₄), nitrous oxide (N₂O), hydrofluorocarbons (HFCs), perfluorocarbons (PFCs), sulfur hexafluoride (SF₆), and nitrogen trifluoride (NF₃).
Each gas is converted to CO₂-equivalent as its emissions are loaded, with 100-year GWPs from the IPCC’s Sixth Assessment Report (AR6) Forster et al., 2021. Methane is valued two ways: fossil methane, from fuel production and use, at 29.8, and non-fossil methane, from farming and waste, at 27.0. Fossil methane is valued higher because, once it breaks down, it leaves CO₂ that was not already in the atmosphere.
Several sources report emissions as CO₂-equivalent using older GWPs from the Fifth Assessment Report (AR5) Myhre et al., 2013. These are converted to AR6, gas by gas.
What is and isn’t counted
B covers emissions from producing goods and services. Some emissions in national inventories do not come from a producing sector, and they are left out:
Household direct emissions. Fuel burned in homes and in personal vehicles is emitted by households, not by an industry, so it is not in
B.Land use, land-use change, and forestry (LULUCF). National inventories, following IPCC guidelines Eggleston et al., 2006, report farming and LULUCF as separate sectors. Farming emissions are counted, in the farm sectors: methane from livestock and rice, N₂O from agricultural soils, CO₂ from liming and urea, and methane and N₂O from burning crop residues in the field. The LULUCF sector is not counted. This leaves out changes in the carbon stored in forests, soils, and other land, including CO₂ removed from the atmosphere, along with emissions from flooded lands and from forest and grassland fires.
Accounting basis
Emissions data are compiled on one of two bases, and the model uses each source as published:
Territorial basis: emissions that occur within the country’s borders. National GHG inventories use this basis, and so do the U.S. and China data.
Residence basis: emissions by the country’s resident businesses, wherever they occur. Air emissions accounts use this basis, as do the FIGARO and ICIO emissions data. Emissions from a country’s airlines and shipping companies abroad are counted for that country.
The residence basis matches how IO tables define a country’s economy, so it suits an IO model. The two bases differ most for countries with large international transport fleets or many visitors. See GHG data by country tier for the basis of each source.
From source emissions to B
Every country’s emissions go through the same steps:
Start from source emissions by source sector. Each source reports emissions on its own sector list, which can be anything from hundreds of activities (the U.S. inventory) to 50 industries (ICIO).
Split broad sectors where better data exist. Some sources lump together sectors with very different emissions, such as electricity, gas, and heat, or all of farming. Where other data can separate them, the broad sector is split first, keeping its total.
Allocate to the common sectors. For the U.S., each inventory activity is allocated to the industries that emit it. For other countries, each source sector’s emissions are allocated to the matching common sectors with ABSR, weighted by U.S. emission intensities. The country’s total for each source sector is kept.
Fill in missing gas detail. Where a source does not separate every gas, the missing split is taken from the U.S. mix for the same sector. This is not needed for the U.S., China, Japan, or the UK, whose sources cover all seven gases.
Convert to CO₂-equivalent with AR6 GWPs. Sources reported in CO₂-equivalent with other GWPs are converted to AR6.
Divide by output. Each industry’s emissions are divided by its output (
x), then converted to commodities using market shares (who makes each commodity), givingBper dollar of commodity output (q). Emissions data years differ by country; see Data years.
GHG data by country tier gives the sources and how each step is done for each tier.
Key assumptions
U.S. intensities shape detail within each source sector
Assumption: Within each source sector, a country’s emissions are allocated to the common sectors in proportion to U.S. emission intensities.
Why we make it: Outside the U.S., emissions data come on far fewer sectors than the 405 common sectors, and the U.S. data are the most detailed available.
How it affects results: Each country’s total for each source sector is correct, but its split between detailed sectors follows the U.S. pattern. Where a country’s mix of processes differs from the U.S. (for example, a different steelmaking route), detailed sectors within the same source sector could be too high or too low.
Household emissions are excluded
Assumption: Direct emissions from homes and personal vehicles are not assigned to any sector.
Why we make it: They are not emitted in producing goods or services, so they do not belong in emission factors for purchases.
How it affects results: Totals in
Bare lower than national inventory totals. Emissions from fuel production for household use, such as refining, are still counted, in the producing sectors.
Mixed accounting basis
Assumption: Each source is used on its published basis, territorial or residence.
Why we make it: Converting between bases needs data on emissions by residents abroad and non-residents at home, which are not consistently available.
How it affects results: Transport emissions in particular may be counted differently for territorial-basis countries (the U.S. and China) than for the others.
Applies to: 2026-rc.1 · Last reviewed: 2026-rc.1
- Forster, P., Storelvmo, T., Armour, K., Collins, W., Dufresne, J.-L., Frame, D., Lunt, D. J., Mauritsen, T., Palmer, M. D., Watanabe, M., Wild, M., & Zhang, H. (2021). The Earth’s Energy Budget, Climate Feedbacks, and Climate Sensitivity. In V. Masson-Delmotte, P. Zhai, A. Pirani, S. L. Connors, C. Péan, S. Berger, N. Caud, Y. Chen, L. Goldfarb, M. I. Gomis, M. Huang, K. Leitzell, E. Lonnoy, J. B. R. Matthews, T. K. Maycock, T. Waterfield, Ö. Yelekçi, R. Yu, & B. Zhou (Eds.), Climate Change 2021: The Physical Science Basis. Contribution of Working Group I to the Sixth Assessment Report of the Intergovernmental Panel on Climate Change (pp. 923–1054). Cambridge University Press. 10.1017/9781009157896.009
- Myhre, G., Shindell, D., Bréon, F.-M., Collins, W., Fuglestvedt, J., Huang, J., Koch, D., Lamarque, J.-F., Lee, D., Mendoza, B., Nakajima, T., Robock, A., Stephens, G., Takemura, T., & Zhang, H. (2013). Anthropogenic and Natural Radiative Forcing. In T. F. Stocker, D. Qin, G.-K. Plattner, M. Tignor, S. K. Allen, J. Boschung, A. Nauels, Y. Xia, V. Bex, & P. M. Midgley (Eds.), Climate Change 2013: The Physical Science Basis. Contribution of Working Group I to the Fifth Assessment Report of the Intergovernmental Panel on Climate Change (pp. 659–740). Cambridge University Press. 10.1017/CBO9781107415324.018
- Eggleston, H. S., Buendia, L., Miwa, K., Ngara, T., & Tanabe, K. (Eds.). (2006). 2006 IPCC Guidelines for National Greenhouse Gas Inventories. Institute for Global Environmental Strategies (IGES). https://www.ipcc-nggip.iges.or.jp/public/2006gl/