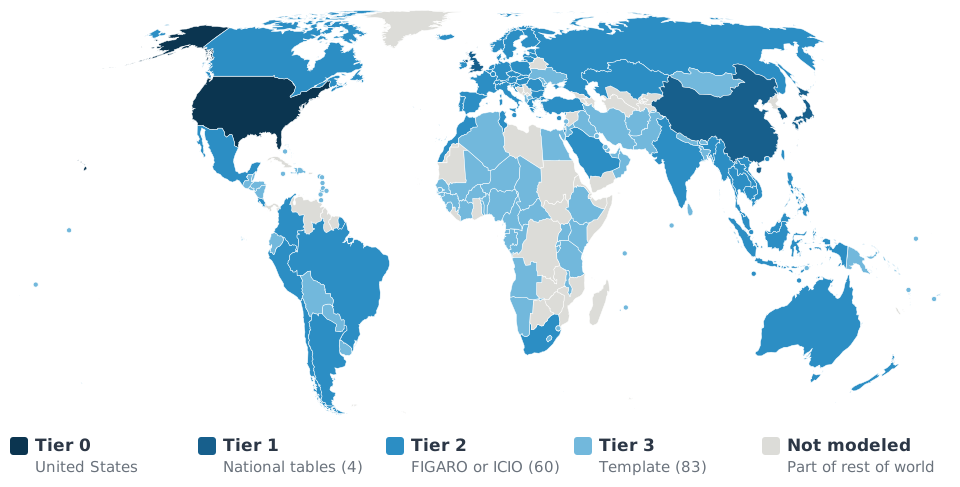
Figure 1:Countries by tier. Darker means more detailed IO data. Small countries are shown as dots. Countries in gray are not modeled separately; they are part of the rest-of-world region.
What each tier starts from
The model covers 148 countries plus a rest-of-world region. A country’s tier sets which type of table it starts from, how much sector detail that table has, and how it is valued.
| Country tier | Countries | Starting tables |
|---|---|---|
| Tier 0 | United States | Make and Use tables for 2024 produced by Cornerstone (nowcast), after redefinitions, following BEA’s 2017 detailed schema |
| Tier 1 | China, Japan, South Korea, United Kingdom | IO tables published by each country’s statistical agency |
| Tier 2 | 60 countries | The country’s table from FIGARO (40 countries) or the ICIO (20 countries) |
| Tier 3 | 83 countries | No usable table: a template built from other countries’ tables |
Tier 0: Detailed, annual IO tables
The U.S. starts from Make and Use tables for 2024 that Cornerstone produces each year (nowcasted tables). They follow the schema of the Bureau of Economic Analysis (BEA) 2017 detailed tables, after redefinitions. BEA’s own detailed tables come out only every five years, and the latest are for 2017; our tables estimate the 2024 economy in the same form. In additional to Make and Use tables, we also estimate the Import Matrix, which defines the import proportion of each cell in the Use table.
Why after redefinitions? Many establishments make secondary products. A hotel runs a restaurant, for example, or a manufacturer does its own repair work. Redefinitions move these secondary products, and the inputs used to make them, to the industry where they are the primary product. Each industry’s input recipe then describes the product it is named for more closely, which makes for cleaner emission factors.
The U.S. tables have 405 sectors. The U.S. tables matter beyond the U.S.: their detailed structure sets the model’s common sector list, and it is used to split other countries’ coarser sectors (see ABSR).
Tier 1: Detailed, periodic national IO tables
Four countries have detailed national IO tables that we use directly.
| Country | Source table | Data year | Sectors | Imports | Units |
|---|---|---|---|---|---|
| China | National Bureau of Statistics national IO table | 2023 | 211 | Not separated in the source; split using China’s domestic and import shares from FIGARO 2023 data | 10,000 yuan |
| Japan | Input-Output Tables for Japan | 2020 | 390 | Separate domestic and import tables | Million yen |
| South Korea | Bank of Korea input-output tables, detailed | 2018 | 381 | Separate domestic and import tables | Million won |
| United Kingdom | ONS Input-Output Analytical Tables, product by product | 2023 | 104 | Separate imports use table | £ million |
All four are symmetric IO tables, with the same sectors on rows and columns. Each one is prepared the same way:
Map to the common sectors. A correspondence links each national sector to one or more of the 405 common sectors. Where one national sector covers several common sectors, it is split using the U.S. structure as weights (structural reflection).
Split domestic and imported inputs using the country’s own domestic and import shares.
Convert to 2024 U.S. dollars. Values are converted at the data year’s average exchange rate, then brought to 2024 prices with a U.S. price index.
Keep the country’s total output. Total output by sector is anchored to the source table’s gross output.
Tier 2: Coarse multi-regional tables
Most of the remaining large economies come from one of two multi-regional tables, FIGARO or ICIO. Both are already harmonized across countries, but they are much coarser than the U.S. tables. Where a country is in both, we use FIGARO.
| FIGARO | ICIO | |
|---|---|---|
| Publisher | Eurostat and JRC | OECD |
| Countries in source table | 49 | 80 |
| Countries used in Cornerstone EEIO | 40 | 20 |
| Version | 2026 | 2025 |
| Data year | 2023 | 2020 |
| Table type | Symmetric IO table, product by product | Symmetric IO table, industry by industry |
| Sectors | 64 products (CPA 2.1) | 50 industries (ISIC Rev. 4) |
| Units | € million, current prices | US$ million, current prices |
FIGARO countries: the 27 EU member states, plus Argentina, Australia, Brazil, Canada, India, Indonesia, Mexico, Norway, Russia, Saudi Arabia, South Africa, Switzerland, and Türkiye.
ICIO countries: Cambodia, Chile, Colombia, Costa Rica, Hong Kong, Iceland, Israel, Kazakhstan, Laos, Malaysia, Morocco, Myanmar, New Zealand, Peru, the Philippines, Singapore, Taiwan, Thailand, Tunisia, and Viet Nam.
Both are inter-country tables, so each country’s own block of the table gives its domestic inputs, and the blocks for all other countries give its imports.
Before mapping, five of FIGARO’s broad sectors are split into finer ones while keeping their totals: electricity, gas, and heat; water, sewerage, and waste; basic metals (steel, other ferrous, non-ferrous); non-metallic minerals (cement, other); mining (five sectors); and agriculture (11 farm sectors). The tables are then mapped to the common sectors with ABSR, and converted to 2024 U.S. dollars the same way as Tier 1.
Tier 3: No IO tables
The 83 countries that are in neither Tier 1 nor Tier 2 have no usable published table. They are not part of the multi-region table; their factors are calculated one country at a time.
Input recipe. All 83 share one template recipe, a weighted blend of three Tier 2 economies: Mexico (30%), Malaysia (30%), and Tunisia (40%).
Imports. Each country’s own import share splits the template into domestic and imported inputs, with the same share for every sector. The supply chains behind those imports are approximated with China’s.
Emissions. Direct emission intensities are scaled to the country’s own emissions per unit of GDP, and electricity uses the country’s own emission intensity.
This template is separate from the rest-of-world region in the multi-region table, which is built from different countries (see The IO model: overview).
Currency
All tables are converted to 2024 U.S. dollars. Sector lists are reconciled in the later steps: mapping to the common sector list, linking with trade data, and balancing.
Key assumptions
Price basis does not change input recipes
Assumption: Countries publish their tables on different price bases (basic, producer, or purchaser prices, and sometimes a mix within one table). We use each table as published and assume these differences do not materially change the direct requirements (
A).Why we make it: Converting every table to one price basis needs product-level tax, subsidy, and margin data for each country, which is not consistently available.
How it affects results: Where product taxes or trade and transport margins are large, as for fuels, input coefficients could differ from those on a common price basis. See User guidance.
U.S. margins for purchaser prices
Assumption: Factors are converted from producer to purchaser prices using U.S. trade and transport margins for every country.
Why we make it: Margin data comparable to the U.S. tables are not available for every country.
How it affects results: Where a country’s wholesale, retail, or transport margins differ from U.S. margins, its purchaser-price factors could be too high or too low. Producer-price factors are not affected. See User guidance.
Tier 3 countries share one recipe
Assumption: Tier 3 countries share one template input recipe. Each country differs only in its overall import share, applied equally to every sector, and in its direct emission intensities, which are scaled to the country’s emissions per unit of GDP, with its own electricity intensity. Their imported supply chains are approximated with China’s.
Why we make it: These countries have no usable published IO table.
How it affects results: Differences in industry structure between Tier 3 countries are not captured, and imports from countries other than China are given China’s supply chains. Factors for these countries carry more uncertainty than those for Tiers 0 to 2.