This user guidance covers two topics:
How to choose the right emission factor: the country, the year and the exchange rate.
How to choose between purchaser and producer price.
A separate page, Margin emission factors, explains how the margin emission factors are prepared, which is mainly of interest to previous USEEIO users.
Choose the right emission factor
Every emission factor is defined by a sector, a location, a year and a price basis. The steps below take you from a line in your spend data to the factor that fits it, and then to an emissions number.
Step 1: Match the purchase to a sector
Find the sector that best describes what you bought, using the sector descriptions that come with the factors. Pick the sector for the final good or service you purchased. You do not add up factors along a supply chain, because each factor already includes the upstream emissions of that sector. A purchase of steel products, for example, already includes the emissions of making the steel.
Each sector is related to a commodity and follows the BEA standard classification. For crosswalks to other industry classifications such as GICS, NACE and ANZSIC, please enquire about the Watershed enterprise product.
Step 2: Choose the country
Use the location where the good or service was produced. When you do not know it for every supplier, work down this hierarchy and stop at the first one you have:
Country of manufacture
Country of the supplier
Country of purchase
Country of your company’s headquarters
If a country has no factor of its own for that sector, use the regional factor for the country’s region, and use the global average only when neither is available.
Why country matters. The same sector can have very different emissions per dollar in different places, because of each country’s energy mix, the structure of its economy and its trade. The chart shows the 2026 producer-price factor for management consulting in six locations.
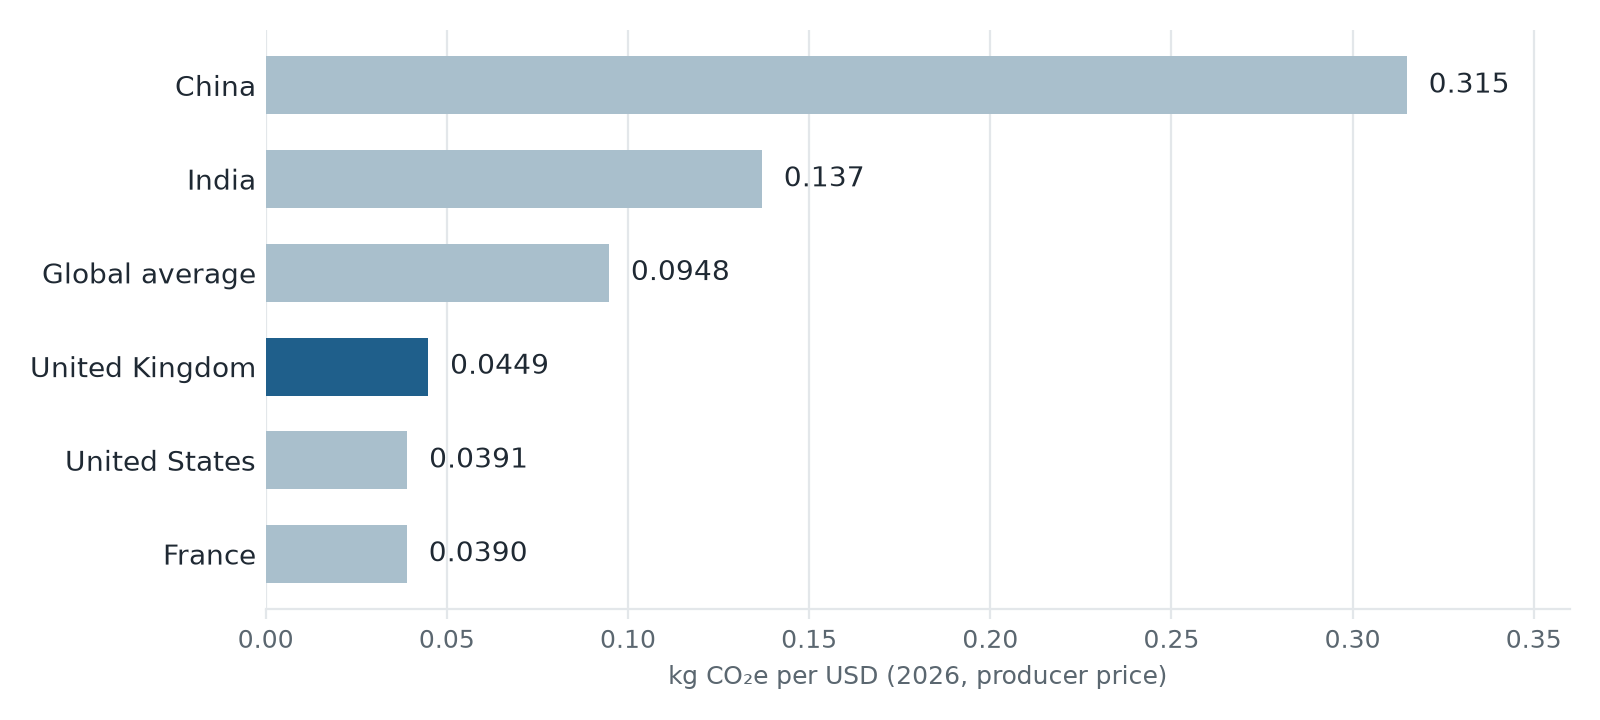
Figure 1:Emission factor for management consulting by location, 2026, producer price (kg CO₂e per USD). The United Kingdom is highlighted because it is used in the worked example below.
Applying one country’s factor to all of your spend would misstate the emissions of suppliers elsewhere. A supplier in China has a factor about eight times the US factor for the same sector. A model with global coverage lets you use the factor of the country where the work is done.
Step 3: Choose the year
Use the factor year that matches the year of your spend. Each factor is expressed in dollars of its own year, so a 2026 factor applies to spend in 2026 dollars. The factors for different years are not interchangeable: the same sector and country has a different factor for each year.
If your reporting year is not the calendar year, use the factors for the calendar year that holds most of your data. If the data splits evenly between two years, use the newer factors. For example, a reporting year from April 2025 to March 2026 has nine months in 2025 and three in 2026, so it uses the 2025 factors.
Step 4: Convert the factor to your currency
The factors are per US dollar. Convert either the factor or your spend to the same currency using the recommended exchange rate information.
Factor per unit of local currency = factor per USD ÷ exchange rate
Use the rate for the year of the spend, not the rate on the day you do the calculation.
Worked example: consulting services in the United Kingdom
A company paid £10,000 for management consulting services from a UK supplier in 2026. The 2026 factor for management consulting in the United Kingdom is 0.0449 kg CO₂e per USD, and the 2026 exchange rate is 0.74283 pounds per US dollar.
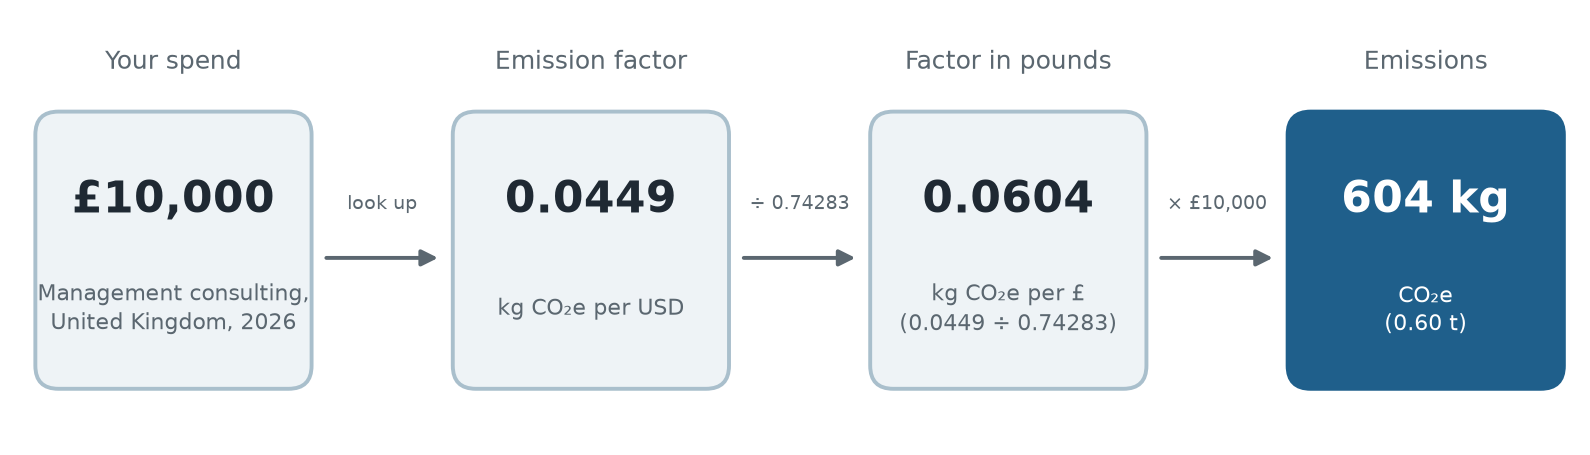
Figure 2:From spend to emissions. Look up the factor, convert it to pounds, and multiply by the spend.
To see the breakdown by gas, apply the same steps to the factor for each gas.
Choose between purchaser and producer price
Each year has two sets of factors. The producer price factors value a good at what the producer receives. The purchaser price factors value it at what the buyer pays, which adds the trade and transport margins on the way to the buyer. The same purchase therefore has a larger dollar value at purchaser price, and each dollar carries less emissions.
If you are unsure, use producer price. Margins are hard to estimate globally, even for government statistical offices, and producer price is the more conservative choice, meaning it gives the higher emissions estimate for the same spend.
| Your situation | Use |
|---|---|
| You are unsure what your spend includes | Producer price |
| You are buying off-the-shelf goods at retail, so what you paid includes the usual wholesale and retail margins | Purchaser price |
| You buy directly from the producer and account for transport and distribution separately in your footprint | Producer price |
| You buy a service | Either: the two sets give the same factor in most service sectors |
The consulting example shows the last case. The management consulting factor for the United Kingdom is 0.0449 at both producer and purchaser price, because a service has no trade margin.
For goods, the choice changes the result. The 2026 factor for computers in the United Kingdom is 0.0814 kg CO₂e per USD at producer price and 0.0539 at purchaser price. In pounds, that is 0.1096 and 0.0726 kg CO₂e per £, so £10,000 of spend gives about 1,096 kg CO₂e at producer price and 726 kg CO₂e at purchaser price, a difference of about a third. Match the factor to the price basis of your spend data: if your invoice is what you paid at retail, pair it with purchaser price.
Applies to: 2026-rc.1 · Last reviewed: 2026-rc.1