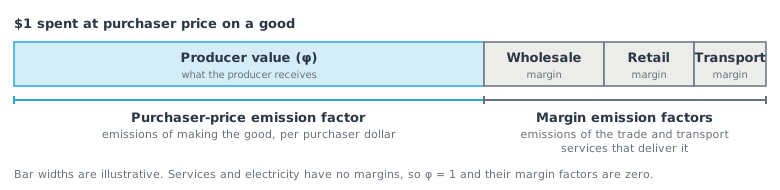
Figure 1:A purchaser dollar pays for the good and for the services that deliver it. The purchaser-price factor covers the first; the margin factors cover the second.
What margins are
Between the producer and the buyer, most goods pass through wholesalers, retailers and transport companies. Their charges are the trade and transport margins, and they are part of what the buyer pays: the purchaser price is the producer price plus the margins.
The purchaser-price factors spread the emissions of making a good over this larger purchaser dollar, but they do not add the emissions of the margin services themselves. Those emissions come from running warehouses, stores, trucks, trains, ships, aircraft and pipelines, and they are what the margin emission factors measure.
How they are calculated
For each U.S. commodity j and each margin type, the margin emission factor adds up, over the margin sectors i of that type, the margin paid to each sector times that sector’s total emission factor:
Margin EF[j] = φ[j] × Σ N[i] × A_margin[i, j]
A_margin[i, j]is the margin paid to margin sectoriper dollar of commodityjat producer price.N[i]is the U.S. total emission factor of margin sectoriat producer price, the same factor published in the PRO table. It includes the margin sector’s whole supply chain, such as the fuel a truck burns and the electricity a store uses.φ[j]is the producer share of the purchaser price ofj(see From producer to purchaser price). It converts the result from per producer dollar to per purchaser dollar, so the margin factor is on the same basis as the purchaser-price factor it is added to.
The margin sectors are grouped into three types:
| Margin type | Margin sectors |
|---|---|
| Wholesale | The 10 wholesale trade sectors (423100, 423400, 423600, 423800, 423A00, 424200, 424400, 424700, 424A00, 425000) |
| Retail | The 9 retail trade sectors (441000, 444000, 445000, 446000, 447000, 448000, 452000, 454000, 4B0000) |
| Transportation | Air (481000), rail (482000), water (483000) and truck (484000) transportation, and pipelines (486000) |
The total margin factor is the sum of the three types. Services and electricity pay no margins, so their margin factors are zero.
Margin data
A_margin is built from U.S. margin data on the margins paid by industries and by business investment. Margins on household purchases and on changes in private inventories are not included. Because most retail margins are paid by households, the retail margin factors are close to zero for many goods.
Each year
The margin factors are prepared for each year of the release, 2024 to 2026. Each margin coefficient is re-priced from 2024 with the price index of its margin sector and the price index of the commodity:
A_margin,t[i, j] = A_margin[i, j] × (PI_i(t) ÷ PI_i(2024)) ÷ (PI_j(t) ÷ PI_j(2024))
and the margin sectors’ factors N for the same year are used, re-priced as described in From the base year to each reporting year. Each margin sector is re-priced with its own index.
How they are published
The margin emission factors are published in their own workbook, with one tab per year ({YEAR}PUR). Each row is one U.S. commodity, with the columns:
| Column | Meaning |
|---|---|
| Code | Good or service code, as in the emission factor tabs. |
| Name | Name of the good or service. |
| Location | USA. |
| Location Name | United States. |
| Total Margin | Sum of the three margin types, in kg CO₂e per USD at purchaser price. |
| Wholesale | Wholesale margin emission factor, in kg CO₂e per USD at purchaser price. |
| Retail | Retail margin emission factor, in kg CO₂e per USD at purchaser price. |
| Transportation | Transportation margin emission factor, in kg CO₂e per USD at purchaser price. |
When to use them
Add them only to purchaser-price factors. A U.S. purchaser-price factor plus the total margin factor gives the emissions of making and delivering a good, per purchaser dollar. Producer-price factors are per producer dollar and exclude the margins, so margin factors should not be added to them.
Avoid double counting. If you account for transport and distribution separately, for example in Scope 3 category 4 (upstream transportation and distribution), do not add the margin factors as well.
U.S. only. Margin factors are prepared only for U.S. commodities, because margin data are available only for the U.S.
For former USEEIO users
The USEEIO Supply Chain GHG Emission Factors were published per purchaser dollar, as factors without margins, margin factors, and factors with margins, the sum of the two Ingwersen, 2024. In Cornerstone EEIO, the U.S. purchaser-price factors correspond to the factors without margins, and adding the total margin factor corresponds to the factors with margins.
Key assumptions
Industry-average margins
Assumption: The margins on each commodity are the average margins paid by U.S. industries and business investment.
Why we make it: The factors are designed for purchases by organizations, and household margins, mostly retail, are much higher than those businesses pay.
How it affects results: Where an organization buys goods at retail, its actual margins are higher than those in the factors, and the margin factors, especially for retail, understate the emissions of delivery.
U.S. margin sectors and margins
Assumption: The margin factors use U.S. margins and the U.S. factors of the margin sectors.
Why we make it: Margin data comparable to the U.S. tables are not available for other countries.
How it affects results: The margin factors describe delivery within the U.S. They are not prepared for other countries, whose distribution networks and transport modes can differ.
Applies to: 2026-rc.1 · Last reviewed: 2026-rc.1
- Ingwersen, W. (2024). Supply Chain Greenhouse Gas Emission Factors v1.3 by NAICS-6 [Data set]. 10.23719/1531143
- BEA. (2009). Concepts and Methods of the U.S. Input-Output Accounts. U.S. Bureau of Economic Analysis (BEA). https://www.bea.gov/resources/methodologies/concepts-methods-io-accounts