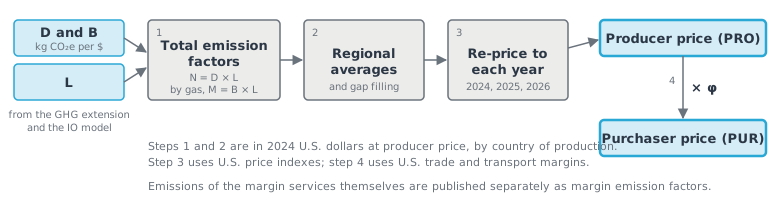
Figure 1:From the model matrices to the published factors. The base calculation is in 2024 dollars; each year’s factors are re-priced from it. φ is the producer share of the purchaser price.
From the model to total emission factors
The IO model gives the total requirements L, the output needed from every sector in every country per dollar of final demand (see Total requirements (L)). The GHG extension gives the direct emission intensities B, the emissions of each gas a sector emits per dollar of its own output (see The GHG extension: overview). Each gas is weighted by its 100-year GWP from the IPCC AR6 as its emissions enter the model, so B is already in kg CO₂e per dollar, one row per gas (see Gases and global warming potentials). Adding up its rows gives the direct emission factors D, what a sector emits itself per dollar.
The total emission factors take one step: multiplying by L traces each sector’s direct emissions through every round of suppliers.
M = B × Lgives the total emission factors by gas. A column ofMgives, for $1 of one commodity from one country, the CO₂e of each gas emitted anywhere in its supply chain. These are the gas columns of the release.N = D × L, which equals the sum of the rows ofM, gives the total emission factors. This is the Total GHGs column of the release.
For the 65 countries in Tiers 0 to 2 and the rest-of-world region, L is solved once for the whole multi-region table, so M follows supply chains across every border in the table. Each column of N is one commodity produced in one country, so a factor describes where a product is made, not where it is bought.
The factors are per dollar of commodity output at producer price, in 2024 U.S. dollars, the model’s base year. They include every upstream supplier, but not the trade and transport services between the producer and the buyer, which are handled in From producer to purchaser price and Margin emission factors.
The direct emission factors D are part of the model but are not published as a separate table.
Tier 3 countries
The 83 Tier 3 countries are not part of the multi-region table, so their factors are calculated one country at a time, from the template described in Tier 3: No IO tables and Tier 3: Template emissions. Each country’s domestic inputs carry its own direct emission intensities through its domestic total requirements, (I − Adom)⁻¹. Its imported inputs carry China’s total emission factors from the multi-region table. The two parts are added to give the country’s M.
Regional and global averages
The release has a factor for each of 21 regions and one global average (GLOB). For each sector and each gas, a regional factor is the average of its member countries’ factors, weighted by each country’s output of that sector in 2024 dollars (q):
N_region = Σ (N_country × q_country) ÷ Σ q_country
Only countries in Tiers 0 to 2 have output data in the model, so Tier 3 countries are not included in the weighted average, even where they belong to the region. A region with no Tier 0 to 2 member uses the simple average of its members’ factors instead. The global average is weighted the same way over every Tier 0 to 2 country. The rest-of-world region is used only inside the model and is not published.
Filling missing country factors
A few country–sector combinations have a total factor of exactly zero, because the source tables have no output or no emissions for that sector in that country. A zero factor would understate emissions for anyone buying from that sector, so it is treated as missing: the country’s factor is replaced by its region’s factor, or by the global average where the regional factor is also zero. The replacement applies to every gas.
From the base year to each reporting year
Every source in the model is first brought to 2024 dollars: values are converted to U.S. dollars at the data year’s exchange rate and re-priced to 2024 with a U.S. price index (see IO sources by country tier). The model therefore produces 2024 factors, per 2024 dollar.
The factors for 2025 and 2026 are re-priced from the 2024 factors, sector by sector:
N_t = N_2024 × PI(2024) ÷ PI(t)
where PI is the sector’s price index and t is the year. When a sector’s prices rise, each dollar buys less of its output, so the factor per dollar falls. The emissions behind the factors are the same; only the dollar they are expressed in changes. Each year’s factors are therefore in current dollars of that year.
The price index is the U.S. Bureau of Economic Analysis chain-type price index for gross output by industry (2017 = 100), mapped to the 405 sectors. The 2026 value is the average of the quarters published at the time of the release. Sectors without their own index keep a constant price. The same U.S. index is applied to every country, region and the global average.
From producer to purchaser price
A purchaser pays more than the producer receives: wholesale, retail and transport businesses add their margins on the way to the buyer. Each dollar at purchaser price therefore contains less of the product itself. The purchaser-price factor converts the producer-price factor to this larger dollar:
N_PUR = N_PRO × φ, where φ = 1 ÷ (1 + Σ A_margin)
Here A_margin holds the margins paid on each commodity, in dollars of margin per dollar of the commodity at producer price, one row per margin sector, and φ is the producer share of the purchaser price.
Margins come from the U.S.
A_marginis built from U.S. margin data, on the industry-average margins paid by industries and business investment. The sameφis applied to every country, region and the global average (see the key assumptions for the IO tables).Services and electricity have
φ = 1. They carry no trade margins, so their producer- and purchaser-price factors are the same.Each year has its own
φ. The margin coefficients are re-priced to each year with the price indexes of the margin sector and of the commodity, soφchanges slightly from year to year.
The purchaser-price factor covers the emissions of making the product only. The emissions of the margin services themselves, such as running warehouses, stores and trucks, are not added to it; they are prepared as separate margin emission factors.
Rounding
Published factors are rounded to three significant figures. Total GHGs is rounded from the unrounded total, so it may not equal the sum of the rounded gas values.
Key assumptions
2025 and 2026 factors reflect price changes only
Assumption: The supply chains and emission intensities of the 2024 model also describe 2025 and 2026. The factors for those years differ from 2024 only by the change in each sector’s price.
Why we make it: Input-output tables and emissions data for 2025 and 2026 are not yet available for any country.
How it affects results: Real changes after 2024, such as a cleaner electricity grid or a shift in where inputs are bought, are not captured in the 2025 and 2026 factors.
One U.S. price index for every country
Assumption: Each sector’s U.S. price change applies to that sector in every country.
Why we make it: Consistent sector-level price indexes in U.S. dollars are not available for every country and year.
How it affects results: Where prices in a country moved differently from U.S. prices, or its exchange rate against the dollar changed, its factors for 2025 and 2026 could be too high or too low.
U.S. margins in purchaser prices
Assumption: The U.S. share of trade and transport margins in each commodity’s purchaser price applies in every country.
Why we make it: Margin data comparable to the U.S. tables are not available for every country.
How it affects results: Where a country’s margins differ from the U.S., its purchaser-price factors could be too high or too low. Producer-price factors are not affected.
Gross-output weights for regional averages
Assumption: A region’s factor for a sector is the average of its member countries’ factors weighted by their output of that sector, using only countries in Tiers 0 to 2.
Why we make it: Output is the best available measure of how much of a sector’s supply each country provides, and it is available only for countries with IO tables.
How it affects results: The regional factor reflects the region’s largest producers. Where a region’s Tier 3 members produce differently from its Tier 0 to 2 members, their purchases are better represented by their own country factors.
Applies to: 2026-rc.1 · Last reviewed: 2026-rc.1
- Miller, R., & Blair, P. (2022). Input-Output Analysis: Foundations and Extensions (3rd ed.). Cambridge University Press. https://www.cambridge.org/us/universitypress/subjects/economics/econometrics-statistics-and-mathematical-economics/input-output-analysis-foundations-and-extensions-3rd-edition?format=HB&isbn=9781108484763
- BEA. (2009). Concepts and Methods of the U.S. Input-Output Accounts. U.S. Bureau of Economic Analysis (BEA). https://www.bea.gov/resources/methodologies/concepts-methods-io-accounts