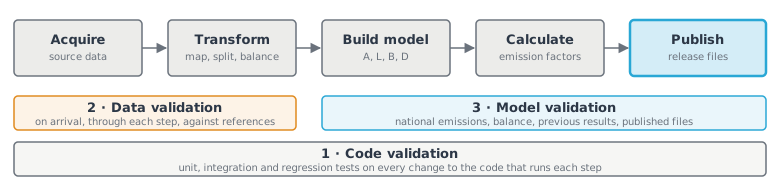
Figure 1:Where each kind of validation runs in the build. Code validation covers every step; data validation follows the data in; model validation checks what comes out. Benchmarking against independent evidence follows the build and feeds the next release (see Why we benchmark).
1. Code validation
The model is built by two code pipelines, described in The code behind Cornerstone EEIO, and every change to that code is tested before it is merged.
Unit tests. About 2,900 automated tests check individual steps against known answers. They include tests of the core formulas, such as
N = D × L, and of the conservation rules the methods rely on: when emissions or output are split, mapped or reallocated, the totals before and after must match. Small worked examples, including a toy model of ABSR and of RAS balancing, are solved by hand and checked against the code.Schema checks. The main tables are checked for their structure every time they are built: the full list of 405 sectors in the right order, every country present, no duplicates, and no missing values. Final demand and exports must not be negative.
Integration and regression tests. Larger tests rebuild whole parts of the model, such as the U.S. tables, the GHG extension, and the global
BandMmatrices, and compare them with a pinned reference result from the release build. A change that moves any value by more than 0.01% fails the test, so every change to the results is deliberate and reviewed. The longest of these tests run on a schedule every weekday.Code quality. Each proposed change is checked automatically for formatting, coding errors and type consistency before the tests run.
2. Data validation
Data are checked when they arrive, as they move through each step of the build, and against references.
On arrival
Structure and coverage. Each source is checked for the countries, sectors, years and units it should contain. A source that is missing a country or sector the model needs is rejected rather than filled silently.
Internal consistency. Published identities in the source are checked before the data are used. For example, the accounting identities of the FIGARO tables must be satisfied, each sector’s emissions in the OECD data must add up to the published total, and the BEA tables are checked against BEA’s own benchmark panel and sign conventions.
Reproducibility. Extracted datasets are regenerated from the original source and compared with the stored copy, and stored copies older than the method that made them are flagged.
Through each transformation
Totals are kept. When a source sector is split, allocated to the 405 common sectors, or reallocated between sectors, each country’s total for each source sector is kept. An independent calculation maps the final results back to every source cell and fails if they do not match (see The GHG extension: overview).
Tables balance. The U.S. Supply and Use tables are balanced so that for every commodity, supply equals use, along with industry output, taxes, subsidies, margins and value added. The multi-region table is balanced with RAS so that each country’s sales match its output within 0.1%; a run that cannot meet a looser 1% limit fails instead of being published. Final demand implied by the balanced table must not be negative.
Facility data set a floor. For U.S. sectors, CO₂, CH₄ and N₂O are not allowed to fall below what the sector’s own facilities report to EPA’s Greenhouse Gas Reporting Program (GHGRP). Sectors whose facilities are almost all covered by the program are also capped from above. Each national inventory total is unchanged by these adjustments.
No missing or invalid values. Values are checked for missing, infinite or negative numbers where they are not allowed, and a calculation that would leave a gas or a country empty stops with an error. How the few negative values in source data are treated is recorded case by case.
Against references and other years
Other years of the same data. Each data update is compared with the previous year of the same source, checking sector counts, totals, and which sectors move most. Over the U.S. time series from 2017 to 2024, changes in emissions are checked against changes in output, sector by sector.
Other sources. The model’s U.S. emissions by sector are compared with facility totals from GHGRP. To choose the Tier 2 source, FIGARO and the OECD ICIO were compared cell by cell for 2020 across the 45 countries both cover, on common grids of 44 sector groups for the IO tables and 43 for emissions. FIGARO was chosen for the 40 Tier 2 countries it covers, and the ICIO is used for the other 20 (see Methods by country).
Gaps. Coverage is checked for every country and sector. Where a country has no output or no emissions for a sector, its emission factor is filled from its region, as described in Filling missing country factors.
3. Model validation
The model as a whole is checked by asking whether it reproduces the data it was built from and how its results compare with previous models.
Recalculating national emissions
An input-output model should recalculate the emissions it was built from. Running the final demand of every country (y) through the model gives the output needed to meet it (L × y), and multiplying by the direct emission factors gives the emissions of producing it:
E_model = diag(D) × L × y
Summed over the world, this equals N × y, the emissions embodied in all final demand. Summed over each country’s own sectors, it gives the emissions produced in that country. Two checks follow:
Against the source data. Each country’s recalculated emissions are compared with its source emissions: the national inventory for the U.S. and the Tier 1 countries, and the FIGARO or OECD totals for Tier 2. A difference points to a problem in balancing or in how emissions were attached to sectors.
Against the model’s own output. The same emissions calculated from output directly,
B × q, must match the result from final demand. Any gap between the two is a balance residual, which should be close to zero.
The U.S. tables are also checked on their own:
Running final demand through the U.S. tables must give back each commodity’s output (see Final demand for the national accounting balance).
The Make and Use tables must give the same output for each commodity and each industry, within 5%. The only expected exceptions are a small number of waste and special sectors, whose definitions in the Cornerstone sector list differ from those in the BEA tables.
Output by commodity and by industry must move consistently with their price indexes, within 5%.
Comparing with previous results
Previous models. Every release is compared with the models it replaces, sector by sector and country by country. For Cornerstone EEIO 2026 these are CEDA 2025 and the USEEIO Supply Chain GHG Emission Factors v1.4 (see Summary of changes vs. CEDA and Summary of changes vs. USEEIO). During development, the U.S. part of the model is also compared with the USEEIO v2.6 model.
Step by step. Changes are added to the model one at a time with the factors recalculated after each step. As a result, every change in the results can be traced to the data update or method change that caused it. These steps are the drivers shown in the release summaries and listed in the Change log.
Large moves. Sectors and countries whose factors move most are reviewed individually. Each large move must be explained by a real change in the data or modeling approach.
Reproducibility. The release build is pinned, and rebuilding it reproduces the published results.
Checking the published files
The published emission factors are read directly from the pinned release build. Before release, the files are checked for their locked column layout, complete gas and sector coverage, regional and global averages for every sector, and NAICS mapping weights that add up to one.
Beyond validation
Validation shows that the model was built as designed. Whether the results agree with independent evidence, such as sector studies and other databases, is the job of benchmarking.
Applies to: 2026-rc