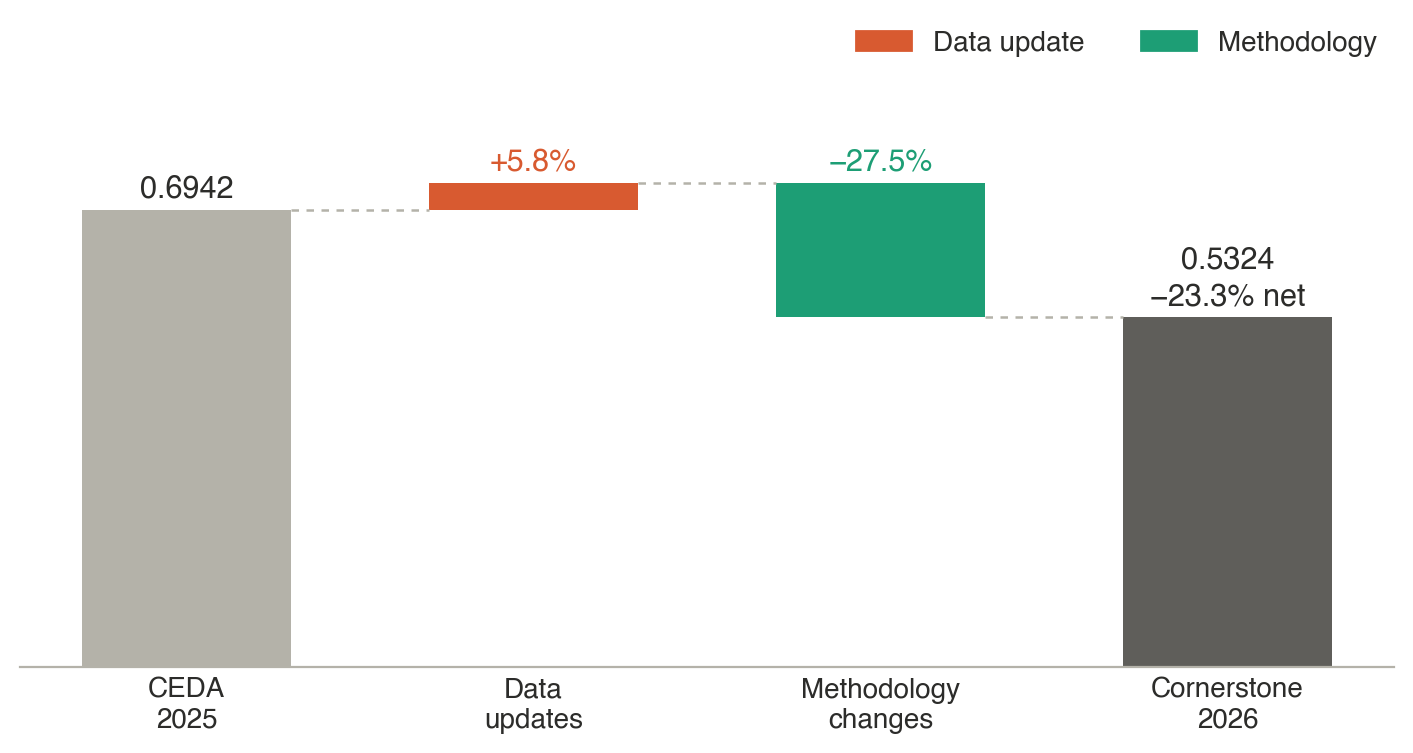
Figure 1:Cornerstone 2026 against CEDA 2025 (global). Global production-weighted total emission factor, in kg CO₂e per 2024 USD, split into data updates and methodology changes.
Your footprint may not follow the median
A company’s change depends on which sectors and countries its spend falls in. A small median can hide large moves in individual sectors, in both directions. From a sample of 400 corporate footprints, the median company will experience a decrease of 14%.
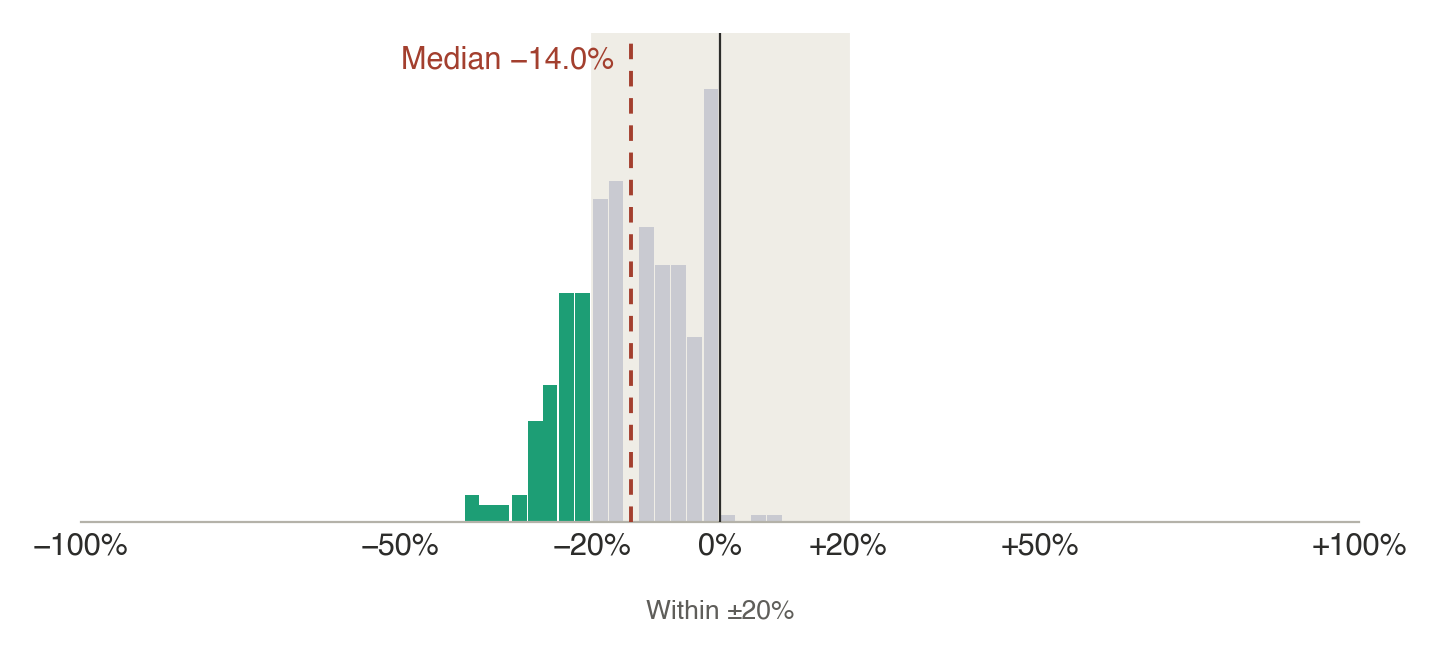
Figure 2:Change in the footprint of 400 companies, Cornerstone 2026 against CEDA 2025. Each bar groups companies by the percentage change in their total footprint. Bars outside the shaded ±20% band are in green. Bar heights are approximate.
What drives the change for CEDA users
Four changes drive ~95% of the impact: China data, Europe and global data, ABSR and benchmark-informed improvements.
Figure 3:Change in the global production-weighted emission factor from CEDA 2025 to Cornerstone 2026, by driver. Percentages are changes relative to the CEDA 2025 baseline. Hover over a bar for details. The vertical axis does not start at zero.
New data for China
Cornerstone adopts the most recent economic data released by the Chinese National Bureau of Statistics (2023 vs. 2020), which reflects methodology changes, changes in the economic structure, and sector-specific decarbonization.
For example, China’s battery factor rises by ~30% driven by a change in the composition of battery production in China. From 2020 to 2023, battery production more than tripled, but more importantly it shifted to require more lithium-ion and less lead-acid as inputs. This is because the majority of the market growth in batteries is in EVs and grid storage, which require lithium-ion. Lithium-ion needs lithium chemicals and power-hungry cell factories, being more carbon intensive per dollar than lead-acid batteries, driving the emission factor up.
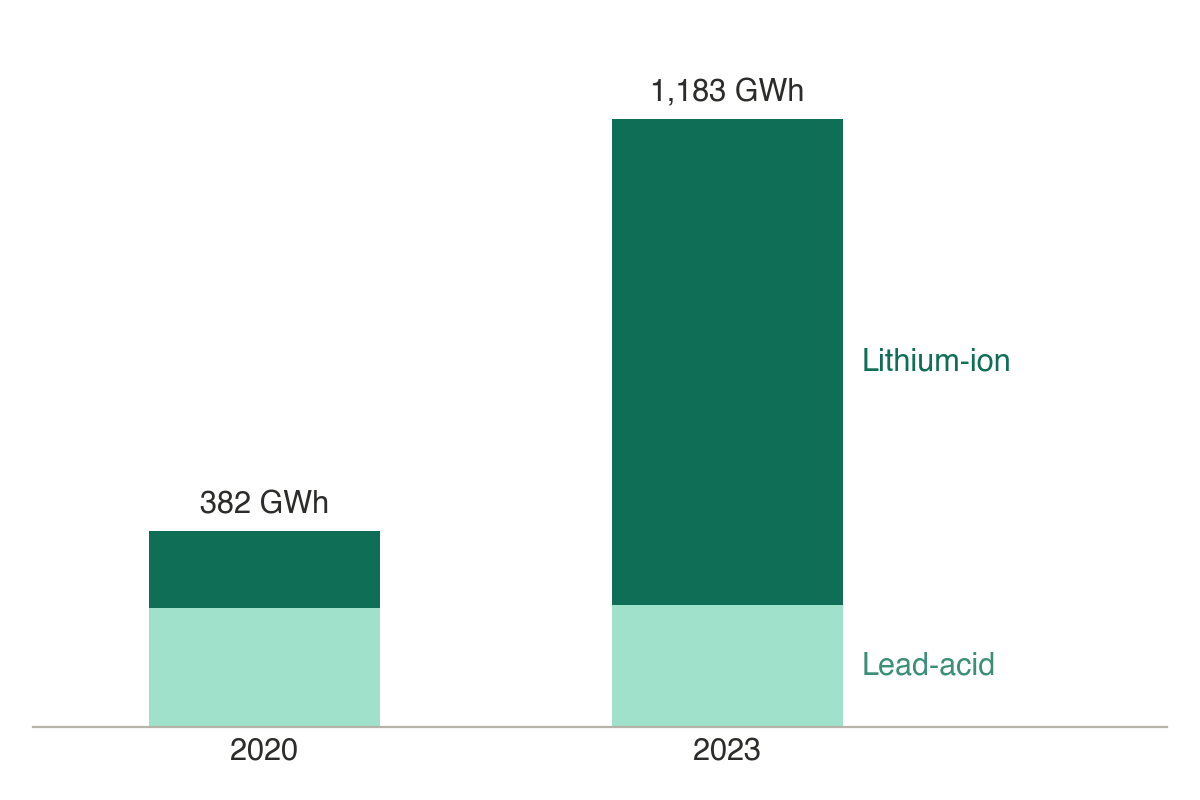
Figure 4:China battery production, 2020 and 2023. Output in GWh. The split by battery type is approximate. Sources: NBS input-output tables 2020 and 2023; MIIT; China lead-acid battery industry statistics.
New data for Europe
Cornerstone adopts the most recent release of FIGARO, Eurostat’s official input-output and emissions dataset. FIGARO is more granular than the OECD dataset for Europe, is available as a time series through 2023, and is updated every year, matching Cornerstone’s release cadence.
This data update lowers European factors by about 4% in median. The most significant change is in electricity factors, which fall in every EU country. This change is driven by an increase in renewable energy and by an increase in energy prices due to the gas-supply shocks the Ukraine war has caused in Europe. For example, Germany’s power factor fell by 60%, as renewables grew from 35% to over 50% of generation and wholesale power prices more than doubled.
Auto-balanced structural reflection (ABSR)
Structural reflection is the method CEDA uses to maintain the same sectoral granularity across all countries.
The ABSR method is an improvement in this methodology. It achieves two goals that are hard to deliver together in a global model:
All countries share the same 405 sectors, so emission factors compare like for like.
Each economy balances production and consumption in terms of monetary transactions and emissions.
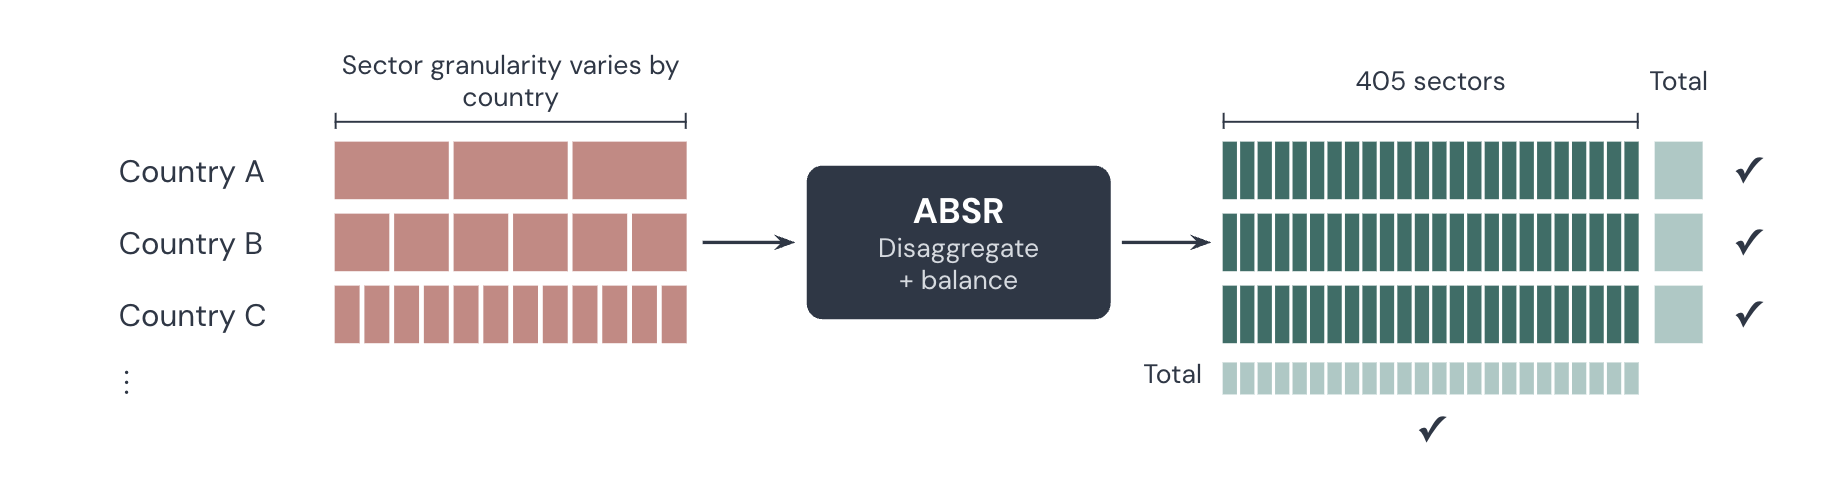
Figure 5:How ABSR works. ABSR disaggregates each country’s economy into the same 405 sectors and balances it, so that production and consumption match in both money and emissions.
Third-party benchmarking
Cornerstone uses benchmark data built from about 1,000 sources to review the key sectors that drive about 50% of global emissions. Each review ends in one of three outcomes:
Sharper benchmark. Scope and price assumptions are aligned, so the external reference is directly comparable to the model.
Model improvement. The gap is traced to a data source or an allocation method, and fixed with more data or a corrected implementation.
Known discrepancy. The difference is documented, because of a limitation in how the model is built or a gap in the data.
| Outcome | Example | Gap before and after |
|---|---|---|
| Sharper benchmark | US electricity: the benchmark covered only private utilities, while the model also includes state and local utilities. Aligning scope reduces the gap. | 15% to 3% |
| Model improvement | Brazil dairy: the model was allocating methane from beef to dairy for lack of country-specific data. The model now uses Brazil’s national accounts of emissions and output for this sector, reducing the gap. | 51% to 5% |
| Known discrepancy | US oil and gas: the benchmark roughly doubles methane using aerial and satellite measurements. The model uses the EPA inventory, as for every other sector. This is documented as a known discrepancy. | 22% (stays) |
For the full list of data and methodology changes, see the Change log. For the equivalent summary against USEEIO, see Summary of changes vs. USEEIO.
For even additional details or custom support on how to navigate the changes in your footprint, sign up for a demo of the enterprise product here.
Applies to: 2026-rc.1 · Last reviewed: 2026-rc.1