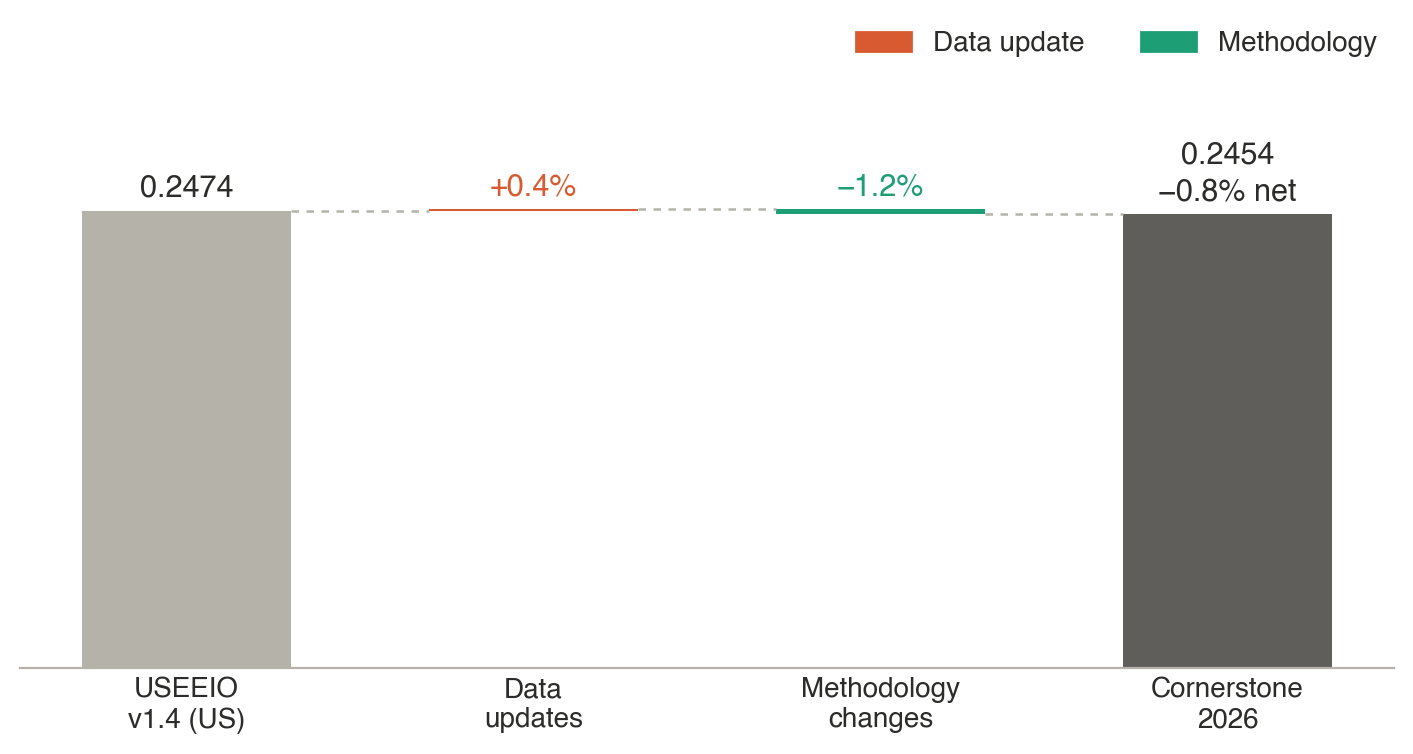
Figure 1:Cornerstone 2026 against USEEIO v1.4 (US). US production-weighted total emission factor, in kg CO₂e per 2024 USD, split into data updates and methodology changes.
Your footprint may not follow the median
A company’s change depends on which sectors and countries its spend falls in. A small median can hide large moves in individual sectors, in both directions. From a sample of 400 corporate footprints, the median company will experience a decrease of 1.3%.
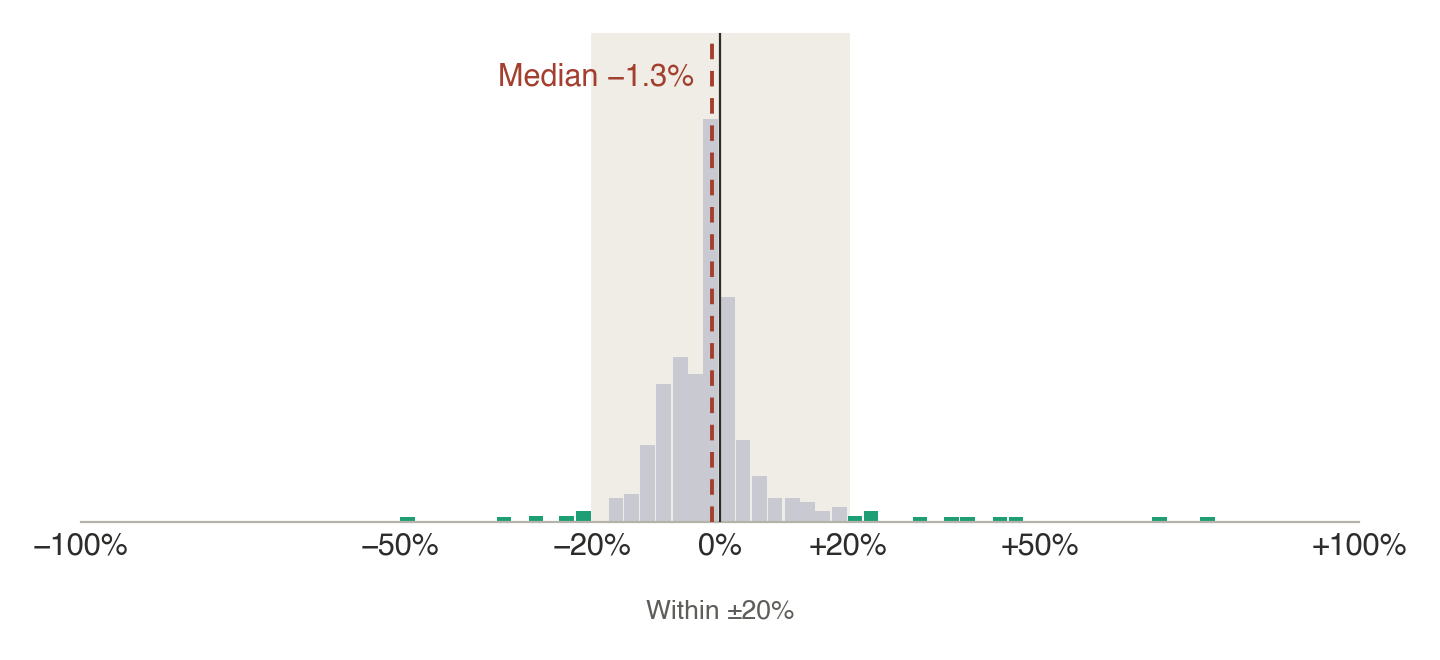
Figure 2:Change in the footprint of 400 companies, Cornerstone 2026 against USEEIO v1.4. Each bar groups companies by the percentage change in their total footprint. Bars outside the shaded ±20% band are in green. Bar heights are approximate.
What drives the change for USEEIO users
Three changes drive ~95% of the impact: model reconciliation, nowcasting and facility-reported data, and the modeling of imports.
Figure 3:Change in the US production-weighted emission factor from USEEIO v1.4 to Cornerstone 2026, by driver. Percentages are changes relative to the USEEIO baseline. Hover over a bar for details. The vertical axis does not start at zero.
Model reconciliation
The USEEIO and CEDA teams reviewed 18 differences between the two models for the US. For each, they adopted one model’s approach or proposed an improvement. The differences can be categorized into 3 types: sectors schema, treatment of economic data and GHG attribution. For details on the differences, see the model reconciliation section of the change log.
One example of these differences is using the BEA after redefinition input output tables instead of the before redefinition tables. A detailed explanation of why this is the approach can be found on GitHub here.
Nowcasting and facility-reported data
BEA publishes detailed (about 400-sector) US input-output tables only every 10 years, with a five-year lag. The latest is for 2017. Nowcasting rebuilds these tables for every year from 2017 to 2024, in BEA’s own structure, using the same official statistics BEA uses. This methodology improvement enables building the time series and providing a more current picture of the US economy. More than 50% of the economic data behind the factors is now backed by reported annual data, beyond inflation adjustments.
Cornerstone EEIO also uses facility-level reported emissions data from the US EPA’s Greenhouse Gas Reporting Program (GHGRP) where most of the facilities in a sector report them, in place of using estimates based on 4-yr frequency fuel use data. The 2024 data includes 6,127 facility reports across 84 industries. This improvement provides a more accurate picture of the US economy. For example, the US sector emissions now match the totals reported across 87 cement plants (61 MT) in 2024. USEEIO undercounted them by ~20%, driving an increase in emission factors in kg CO₂e/USD.
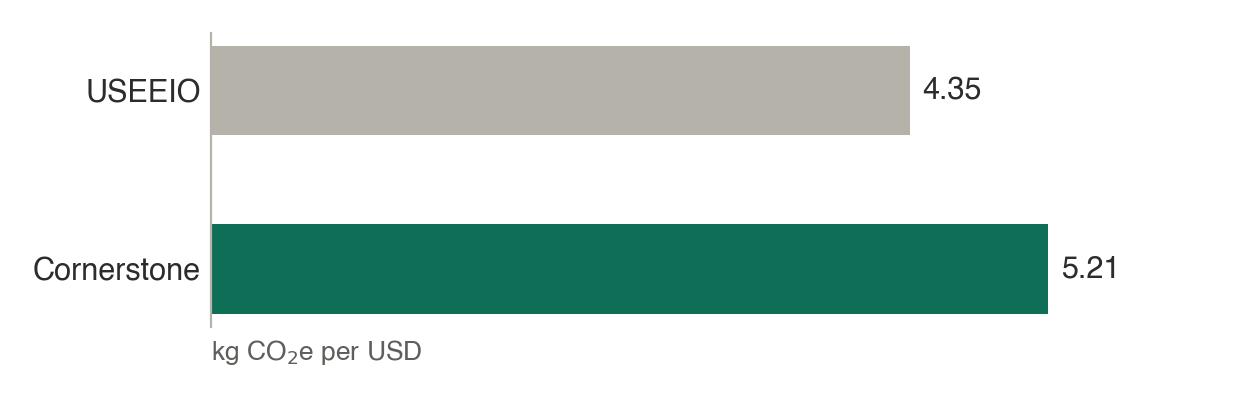
Figure 4:Cement sector emission factor, USEEIO v1.4 and Cornerstone 2026. In kg CO₂e per USD.
Trade impact: modeling imports
USEEIO treated the US as a closed economy: every product used in the US was assumed to be made in the US. Cornerstone uses trade data to model each import in the country that produced it. Many imports come from more emissions-intensive economies such as China and India, so US factors tend to rise by 10 to 30% on average. This is the main upward pressure and the main reason for the change for USEEIO users.
One example is light trucks and utility vehicles. The US factor rises by ~24%, mostly because many of their components are now modeled as imports from the countries that make them. Public data suggests that about 60% of the components of a US-assembled light truck are imported, with Mexico the largest source, followed by Europe and Canada (see Figure 5).
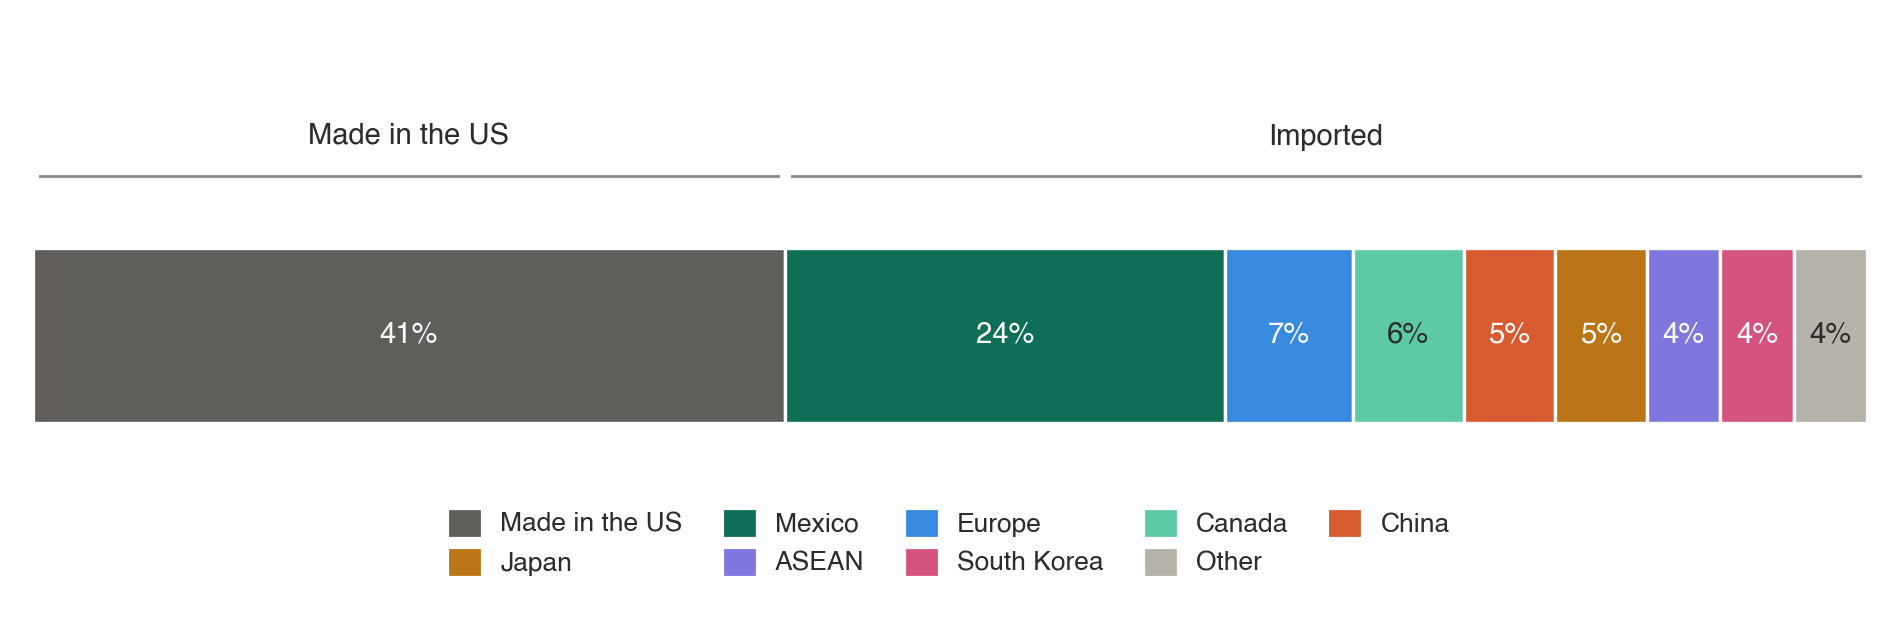
Figure 5:Estimated origin of the components of a US-assembled light truck. Sources: NHTSA AALA parts content data; International Trade Administration data as reported by MNI (March 2025).
For the full list of data and methodology changes, see the Change log. For the equivalent summary against CEDA, see Summary of changes vs. CEDA.
For even additional details or custom support on how to navigate the changes in your footprint, sign up for a demo of the enterprise product here.
Applies to: 2026-rc.1 · Last reviewed: 2026-rc.1