Why have a Release Candidate?
2026 is an unprecedented year of development because it is the first time we are combining CEDA and USEEIO into one model and also the first time we are releasing a time series. The intention behind having a two phased approach to the release is to give companies additional time for impact assessments on their most recent year of measurements, while the time series is under development. This enables companies to understand footprint changes before applying the time series.
Will there be any changes for years 2024 to 2026 once the time series is released?
We do not foresee significant changes, but some sector-country combinations could be impacted by improvements driven from the time series model development. Users should consider this version as a release candidate and wait for the final 2026 version of this model that will be released in early December for reporting and rebaselining purposes.
What to expect from the time series?
The time series (2017-2026) will use the same methodology for all years and only change the underlying data that represents each country’s economic structure and emissions data. For example, in the US each year of the dataset will use the US electricity grid emissivity for each year, capturing any decarbonization on this sector year over year.
This is the first time that either USEEIO or CEDA releases a time series built this way. In the past CEDA has released a time series built with inflation adjustments for years prior and after the base year. Moving forward the Cornerstone EEIO will only apply inflation adjustments to the years after the base year, for which there is no reported data (e.g. 2025 and 2026 are inflation adjusted from the 2024 base year).
To learn more about the methodology behind Cornerstone EEIO refer to the IO model, the GHG extension and Calculating the emission factors.
What changed
Cornerstone EEIO 2026 combines USEEIO’s detailed picture of the US economy with CEDA’s global coverage and trade modeling, representing a step change improvement to both models.
Three groups of improvements sit behind the changes.
A more current picture of the US economy that accounts for imports. US input-output tables are rebuilt for every year from 2017 to 2024, manufacturing uses facility-reported emissions, and imports are modeled where they are made.
Newer data for Europe, the UK and China, and better gap-filling for the rest. Europe moves from the OECD’s ICIO tables to Eurostat’s FIGARO (through 2023). China moves to the latest National Bureau of Statistics tables (through 2023), with more sectors. Countries without data are filled with the auto-balanced structural reflection method.
A validation process that feeds back into the model. Third-party benchmarks review the sectors behind about 50% of global emissions. Gaps are traced and fixed in the data or the method and documented when unresolved.
Together these make the 2017–2026 time series possible.
Why do these improvements matter?
They translate real world changes to corporate footprints. Three examples show how:
New data for China
Cornerstone adopts the most recent economic data released by the Chinese National Bureau of Statistics (2023 vs. 2020), which reflects methodology changes, changes in the economic structure, and sector-specific decarbonization.
For example, China’s battery factor rises by ~30% driven by a change in the composition of battery production in China. From 2020 to 2023, battery production more than tripled, but more importantly it shifted to require more Lithium-ion and less Lead-acid as inputs. This is because the majority of the market growth in batteries are in EVs and grid storage that require lithium-ion. Lithium-ion needs lithium chemicals and power-hungry cell factories, being more carbon intensive per dollar than lead-acid batteries, driving the emission factor up.
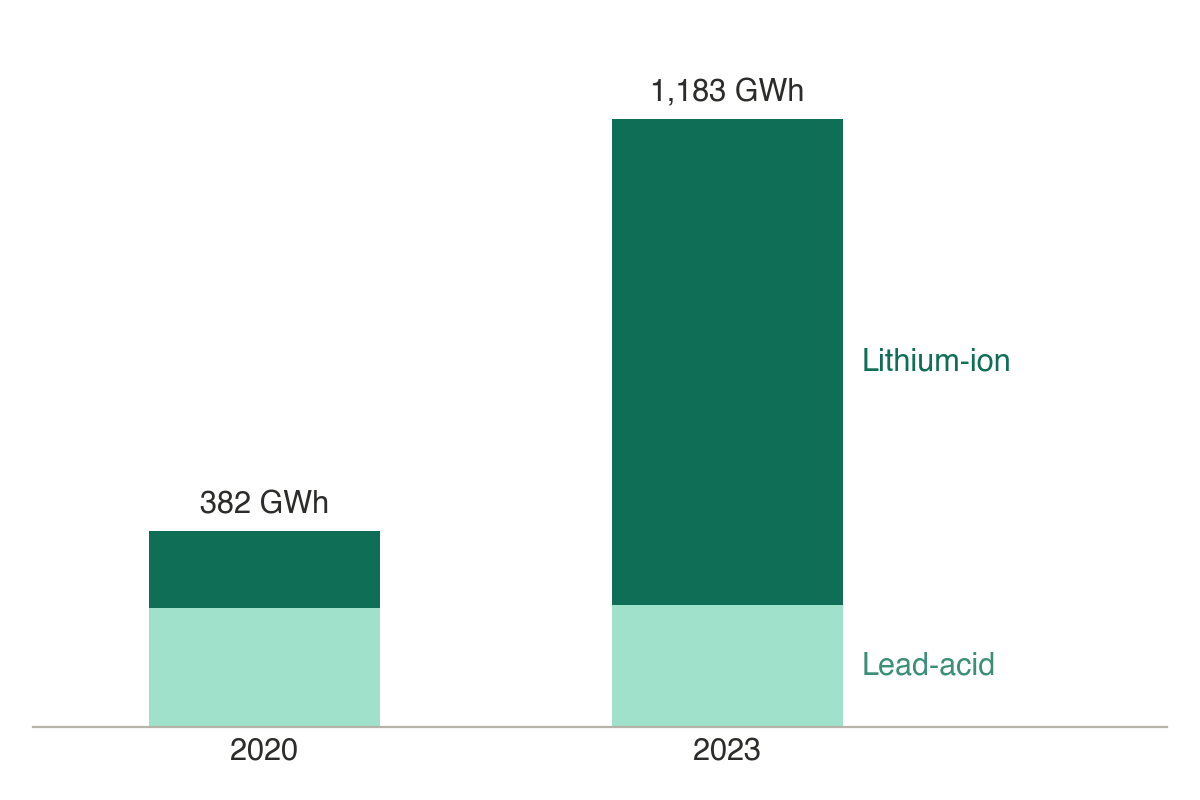
Figure 1:China battery production, 2020 and 2023. Output in GWh. The split by battery type is approximate. Sources: NBS input-output tables 2020 and 2023; MIIT; China lead-acid battery industry statistics.
New data for Europe
Cornerstone adopts the most recent release of FIGARO, Eurostat’s official input-output and emissions dataset. FIGARO is more granular than the OECD dataset for Europe, is available as a time series through 2023, and is updated every year, matching Cornerstone’s release cadence.
This data update lowers European factors by about 4% in median. The most significant change is in electricity factors, which fall in every EU country. This change is driven by an increase in renewable energy and by an increase in energy prices due to the gas-supply shocks the Ukraine war has caused in Europe. For example, Germany’s power factor fell by 60%, as renewables grew from 35% to over 50% of generation and wholesale power prices more than doubled.
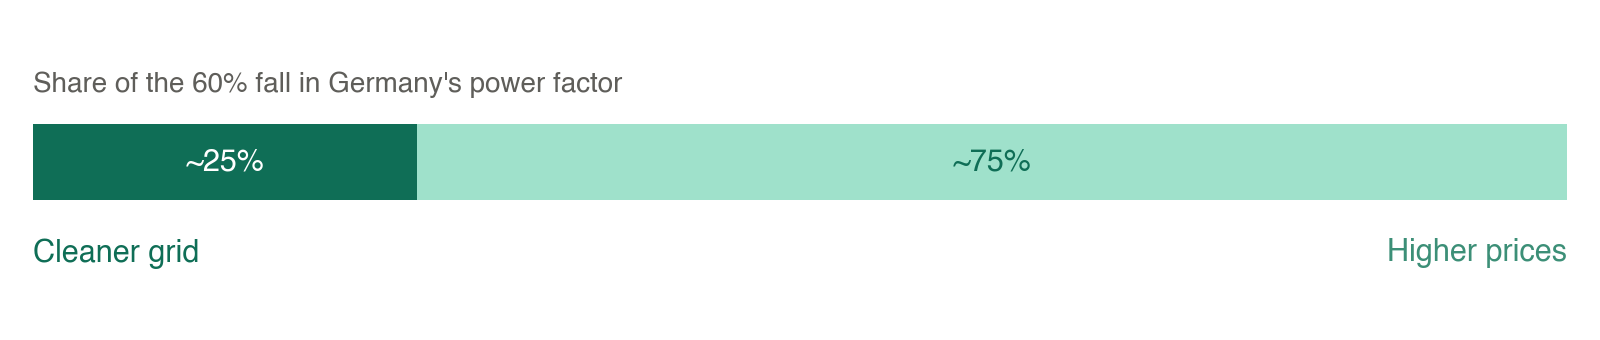
Figure 2:Germany’s power emission factor falls by 60%. About 25% of the change comes from a cleaner grid, as renewables grew from 35% to over 50% of generation, and about 75% from higher prices, as wholesale power prices more than doubled, from about €44 to €95 per MWh. Sources: Ember, Öko-Institut, SMARD, Vattenfall.
Incorporation of imports in the US
USEEIO treated the US as a closed economy: every product used in the US was assumed to be made in the US. Cornerstone uses trade data to model each import in the country that produced it. Many imports come from more emissions-intensive economies such as China and India, so US factors tend to rise by 10 to 30% on average. This is the main upward pressure and the main reason for the change for USEEIO users. One example is light trucks and utility vehicles. The US factor rises by ~24%, mostly because many of their components are now modeled as imports from the countries that make them. Public data suggests that about 60% of the components of a US-assembled light truck are imported, with Mexico the largest source, followed by Europe and Canada (see Figure 3).
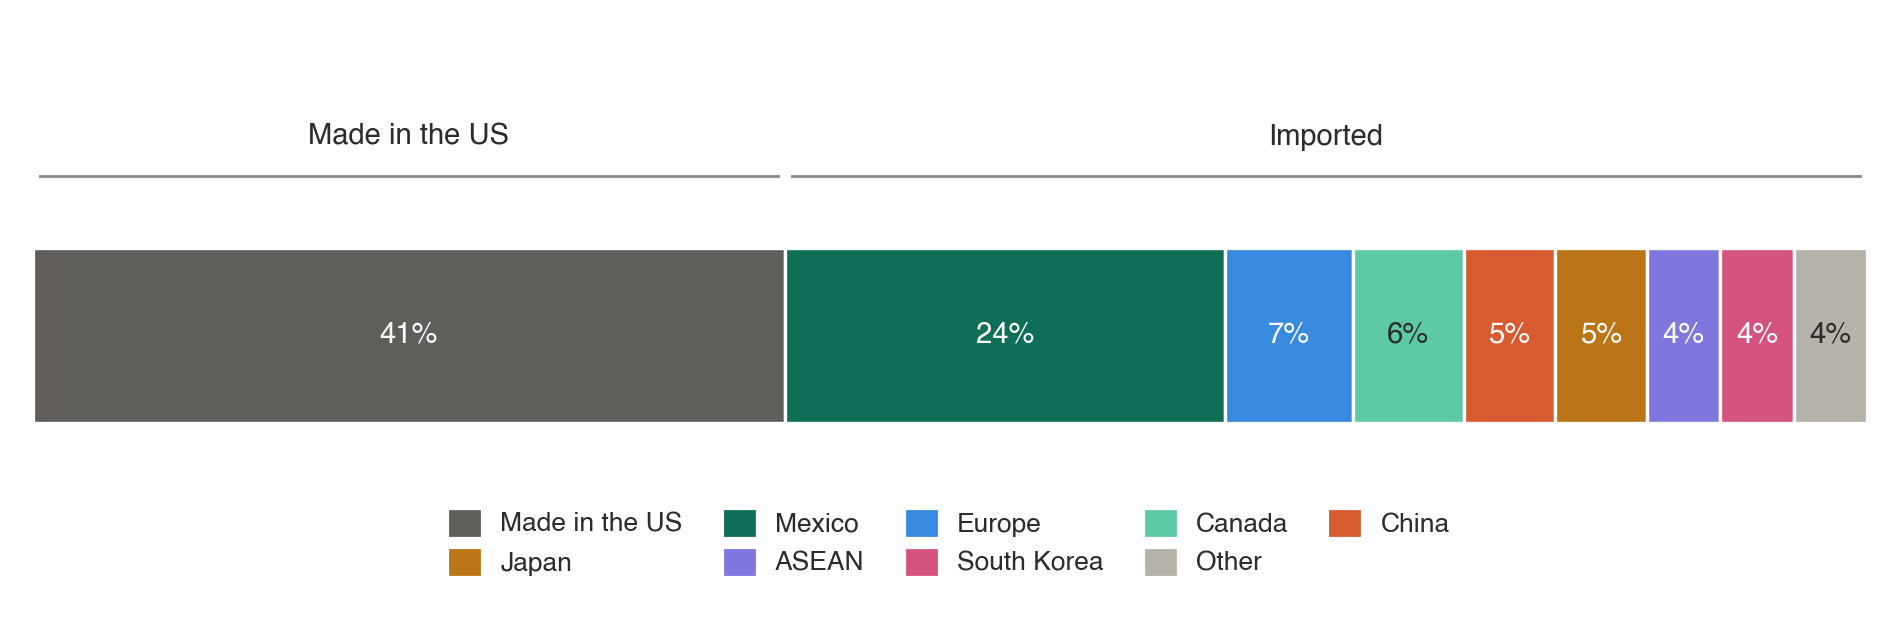
Figure 3:Estimated origin of the components of a US-assembled light truck. Sources: NHTSA AALA parts content data; International Trade Administration data as reported by MNI (March 2025).
How do the emission factors change?
The charts compare the new factors with each model they replace.
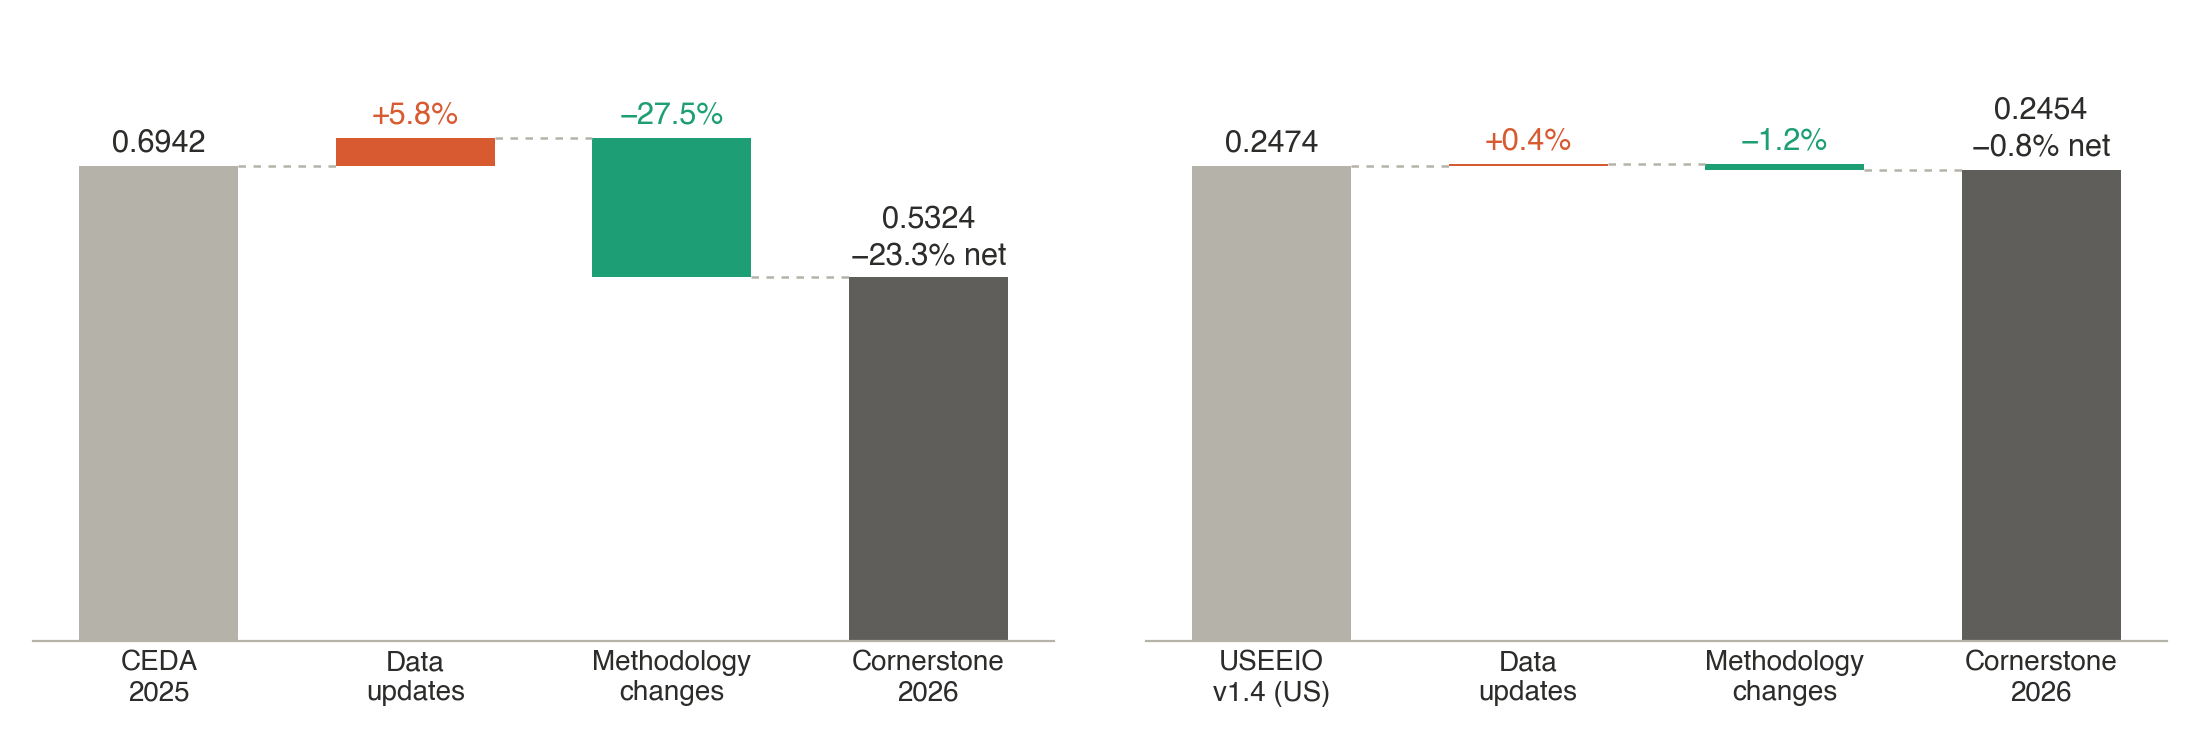
Figure 4:Emission factors fall 23.3% against CEDA 2025 and 0.8% against USEEIO v1.4 (US). Production-weighted totals in kg CO₂e per 2024 USD, split into data updates and methodology changes.
For a more detailed summary of the changes against USEEIO or CEDA, please refer to Summary of changes vs. USEEIO and Summary of changes vs. CEDA. The full list of data and methodology changes is in the Change log. For even additional details or custom support on how to navigate the changes in your footprint, sign up for a demo of the enterprise product here.
Applies to: 2026-rc.1 · Last reviewed: 2026-rc.1